Independent Variables, Dependent Variables and Equations about their Relationship to each other3/9/2015 
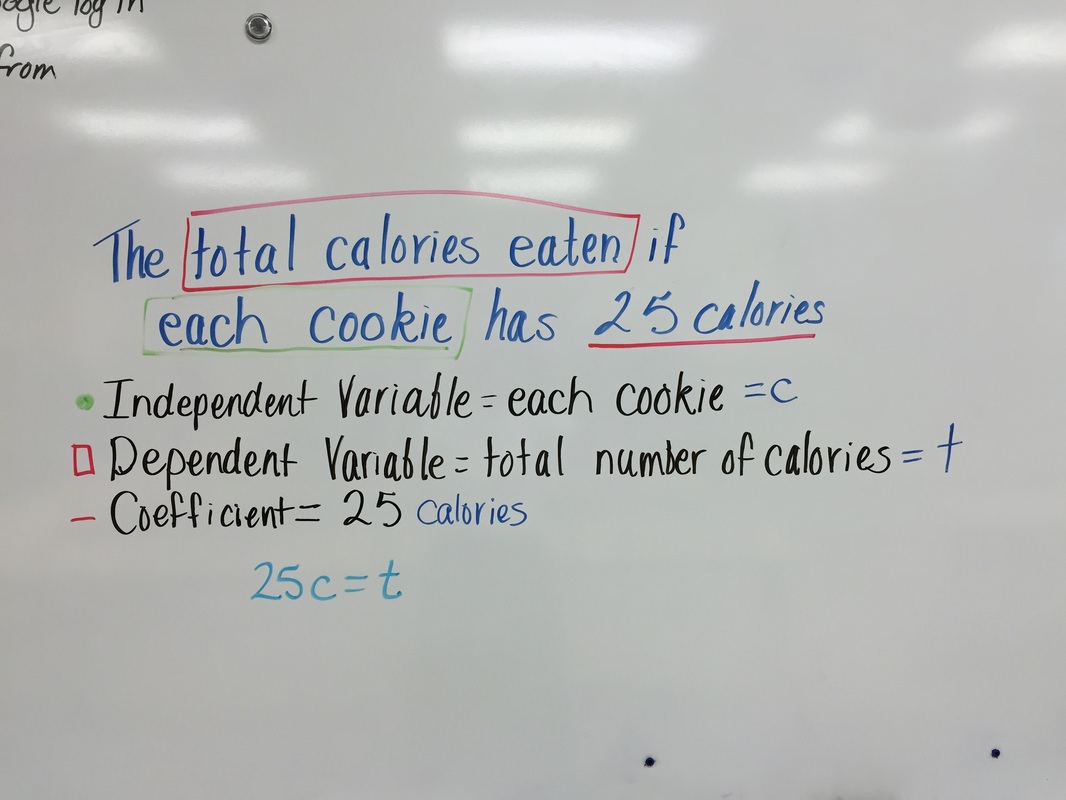
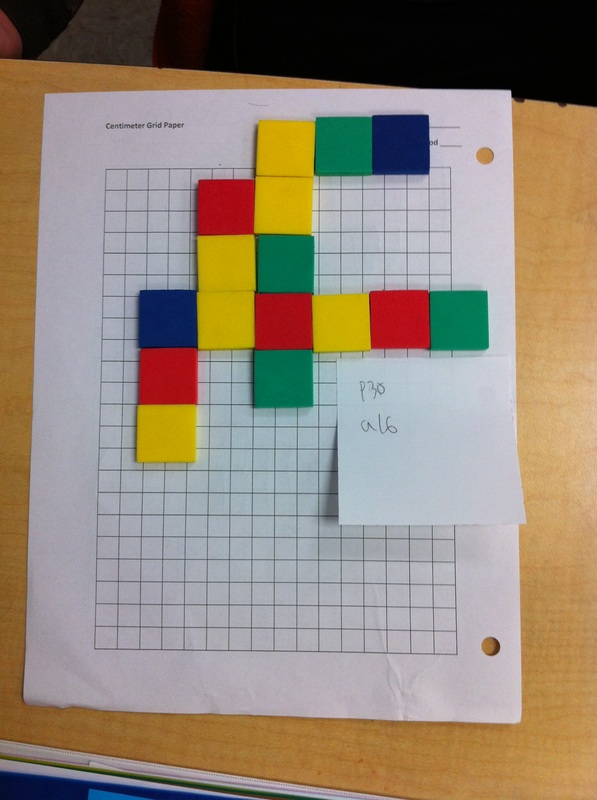
Along with creating tables and graphs, the students are also working on translating problems (like the one in the picture) into equations. They must identifiy the two variables (independent and dependent) and then the coefficient. This all sounds incredibly important (especially that coefficient), but it is not. The dependent variable is determined by what happens to the independent variable (and that what happens is the coefficient). Examples: How many miles you drive (the dependent variable) is determined by the number of hours (independent variable) you drive AND your average speed per hour (the coefficient) or distance = time x mph.
0 Comments
Learning how to interpret graphs and tables (what can we learn from the information) and learning how to create graphs from tables or tables from graphs are NOT hard skills. Interpretation takes a little care and patience, while creation requires thinking and neatness. Tables and graphs should have a title and be labeled. Anyone reading a table or graph you have made should be able to tell exactly what it is about and what it means mathematically because of the title and labeling.
Our graphs so far have been in quadrant I and (so far) have only involved positive numbers. The x axis is the INDEPENDENT VARIABLE. This variable drives the information gathered for the y axis (or DEPENDENT VARIABLE). The numerical information given for the Independent Variable determines the scale (or how to number the lines along the x-axis). The scale on an axis should not change, NO MATTER WHAT THE NUMBERS SHOW. If you start the scale at .5 (because something is being measured and shown every 1/2 hour), the scale stays .5 between each line. EVEN if the data shows 1/2 hour, 1 hour, 1 1/2 hours, 2 hours, 3 hours...the data skipped a 1/2 hour BUT YOUR GRAPH SHOULD NOT (at least for the independent variable). A table can skip the information. So a table will show actual data gathered, while a graph will show all the independent variable scale, but only the dependent variable data collected. YIKES! Many of my students are struggling with multiplying and dividing multi-digit numbers. On our quiz, I noticed students repeatedly using repeated addition or repeated subtraction instead of multiplication or division. This is not efficient math work. These skills were merely reviewed during our unit. I have been searching for help. There will be homework every night to practice these skills (only a few problems a night). These websites may also prove helpful for them to watch or to read.
http://www.wikihow.com/Do-Long-Multiplication - a step-by-step how to do long multiplication. Khan Academy-this website is loaded with videos and practice problems. I rely on it to stretch myself mathematically. The teacher is not exciting, but he is thorough. https://www.khanacademy.org/math/arithmetic/multiplication-division/multi_digit_multiplication/v/multiplication-6-multiple-digit-numbers - watch him teach multiplication http://www.mathsisfun.com/numbers/multiplication-long.html - another site with step-by-step instruction on multiplication https://www.khanacademy.org/math/arithmetic/multiplication-division/long_division/v/level-4-division - Khan Academy's demonstration of long division https://www.khanacademy.org/math/arithmetic/multiplication-division/long_division/e/division_4 -again, Khan Academy http://www.homeschoolmath.net/teaching/md/two_digit_divisor.php - a step-by-step lesson on long division You can also check YouTube for demonstrations of both concepts. Since I have not previewed these videos, I hesitated to provide links (I'm sure the content is good, but sometimes other stuff appears onscreen). This week is a review of multi-digit multiplication and division (including long division). The connections I am trying to reinforce are the relationship between the fractions like 56/100 and the decimal 0.56. They remember multiplying decimals and counting how many decimals are in the multiplication side of the problem and applying that many decimal places to the left in the product. Division will be a review of moving any decimal in the divisor until it is a whole number, and moving the decimal in the dividend the same number to the right.
Therefore, the big idea for this unit is knowing multiplication and division facts. We will be reviewing the "how to's" of each concept, but it is simply a review. There is a family activity for sorting decimals and fractions tonight. The students did it in class, now you can do it at home (just to see what we do in math!). My picture hasn't come through, but the cards should sort like this(card letter or number): (A, 5, 13) (B, 3, 8, 12) (C, 6, 14) (D, 4, 15) (E, 2, 11) and (F, 1, 7, 9, 10).
The classes also wrote three rules to remember when adding or subtracting decimals. First, write the problem vertically (this helps with the second step). Second, when you write the problem, line those decimals and place value up correctly. Third, be sure to carry the decimal point straight down into the answer. In class today, we talked about unit rates (not a new concept, we learned about them earlier this year). These are things like miles per hour OR cost per ounce. Unit rates compare two things, with one of the things being reduced to one (ex: 60 mph is 60 miles in ONE hour). Below you will find a picture that not only shows how to set up the math division problem for finding miles per hour, but its reverse as well, hours per mile (comparing how much of an hour is used in ONE mile). The next picture will show how to use this information within a table to figure out if it isn't one hour, how much distance is covered (or the reverse-if it isn't one mile, how much time is taken). These concepts are not difficult, but they do take practice.
The classes will be starting the year with a review of decimal operations. Addition, subtraction, multiplication, and division using numbers with decimals should be a review for previously learned skills. With addition and subtraction, students must remember to let the decimal rule when lining up the problem. This may mean adding zeroes to provide a digit to add or subtract, but the decimal rules the line up.
With multiplication, the decimal does not have to line up to work the problem. The number of decimal places to the right of the decimal in both parts of the multiplication problem tells where to place the decimal in the product. In division, the decimal in the divisor is moved to the right until there are no digits to the right (so it is a whole number). BUT however many places you move the decimal to the right in the divisor, you must also move the decimal in the dividend (and therefore the quotient as well). The two examples that follow model the concept that squares (or rectangles closer to square shapes) have the greatest area for a fixed perimeter. With a fixed area of 18 units squared, the perimeter was as much as 38 units or as small as 18 units. With a fixed area of 36 units squared, the perimeter was as much as 74 units or as small as 24 units. Long and thin areas = greater perimeter. Square areas (or as close as we can get) = smaller perimeter.
These are student samples of some of the things we are learning about area (Length x Width, or the number of tiles) and perimeter (2Length + 2Width). We have learned (and their examples will show) learned that you can have an unchanging perimeter and a changing area OR you can have an unchanging area and a changing perimeter. The first four examples show an unchanging area of 6 square units and changing perimeters. The following four examples show a fixed area of 24 square units and changing perimeters.
|
AuthorWrite something about yourself. No need to be fancy, just an overview. Archives
September 2015
Categories |