|
Learning how to interpret graphs and tables (what can we learn from the information) and learning how to create graphs from tables or tables from graphs are NOT hard skills. Interpretation takes a little care and patience, while creation requires thinking and neatness. Tables and graphs should have a title and be labeled. Anyone reading a table or graph you have made should be able to tell exactly what it is about and what it means mathematically because of the title and labeling. Our graphs so far have been in quadrant I and (so far) have only involved positive numbers. The x axis is the INDEPENDENT VARIABLE. This variable drives the information gathered for the y axis (or DEPENDENT VARIABLE). The numerical information given for the Independent Variable determines the scale (or how to number the lines along the x-axis). The scale on an axis should not change, NO MATTER WHAT THE NUMBERS SHOW. If you start the scale at .5 (because something is being measured and shown every 1/2 hour), the scale stays .5 between each line. EVEN if the data shows 1/2 hour, 1 hour, 1 1/2 hours, 2 hours, 3 hours...the data skipped a 1/2 hour BUT YOUR GRAPH SHOULD NOT (at least for the independent variable). A table can skip the information. So a table will show actual data gathered, while a graph will show all the independent variable scale, but only the dependent variable data collected. 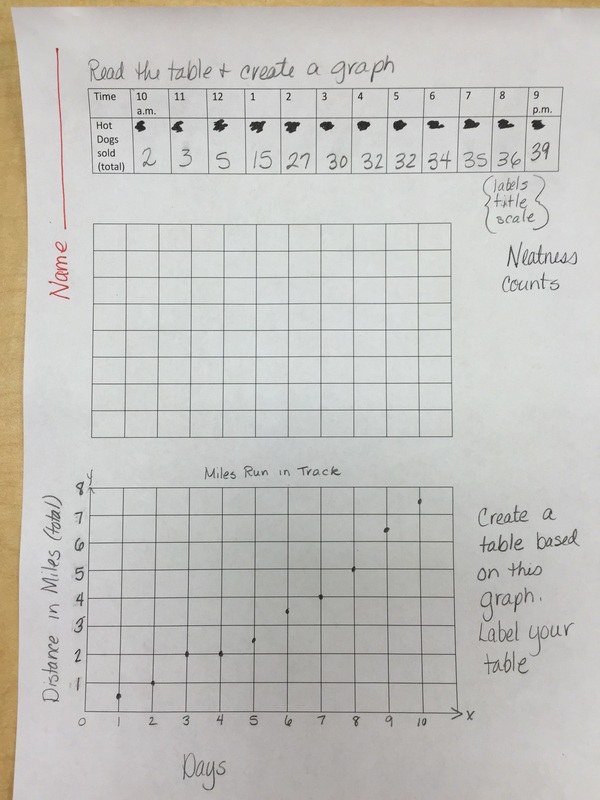
|
AuthorWrite something about yourself. No need to be fancy, just an overview. Archives
September 2015
Categories |
 RSS Feed
